We introduce Streetchange, a new way of measuring changes in the physical appearances of neighborhoods using a computer vision algorithm. We calculate Streetchange by algorithmically comparing Google Street View images of the same location captured in different years.
Physical urban change—the evolution of cities' public and private infrastructure—has been of interest to policymakers, as well as scholars in economics, sociology, and urban planning for decades. However, it has been difficult to measure urban change in ways that are quantitative, robust, and scalable. In the present work, we developed a computer vision method that allows us to quantify urban change at high spatial resolutions using image time-series from Google Street View. We used this method to compute urban change for more than 1.5 million street blocks from five major American cities.
We aggregated Streetchange data from street blocks at the census tract level for the five American cities (Baltimore, Boston, Detroit, New York, and Washington DC). In our paper, we linked Streetchange to demographic and economic characteristics of neighborhoods, in order to understand which neighborhoods experience physical change. We found that physical growth occurs in geographically and physically attractive neighborhoods with dense, highly-educated populations.
Contact: Nikhil Naik, naik@mit.edu
We accessed more than 1.6 million Google Street View images of street blocks from Baltimore, Boston, Detroit, New York, and Washington DC, captured from the same locations in 2007 and 2014.
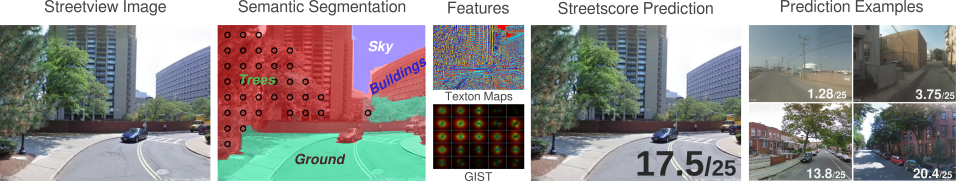
For all images, we calculated Streetscore, a metric for perceived safety of a streetscape. Streetscore reflects the combined perception of thousands of internet users. We computed Streetscore using a regression model based on two image features: GIST and texton maps, obtained from pixels of two object categories—ground (containing streets and sidewalks) and buildings.
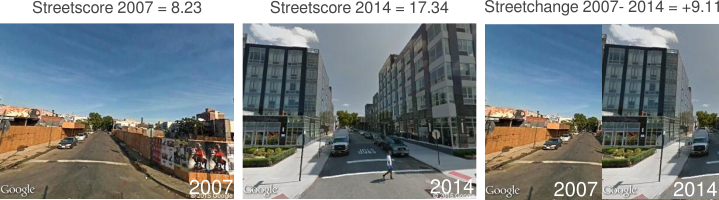
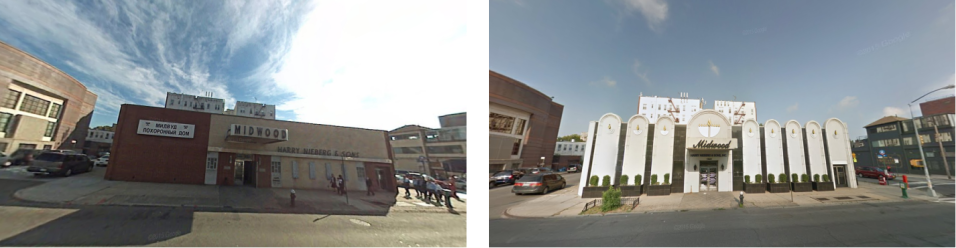
Next, we calculated Streetchange: the difference between Streetscores of a pair of images of a street block captured in 2007 and 2014. This image shows the Streetchange for 568 Union Avenue, Brooklyn, New York 11211.
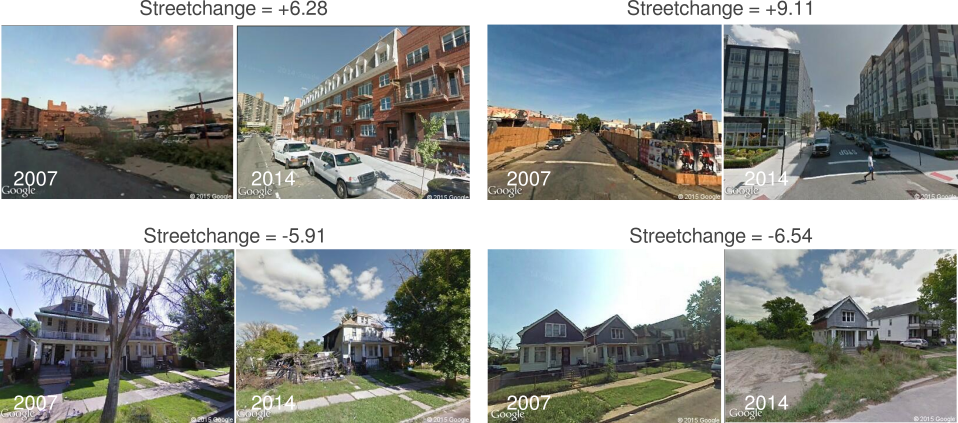
A large positive Streetchange value is typically indicative of major new construction (top row). A large negative Streetchange value is typically indicative of abandoned or demolished housing (bottom row).
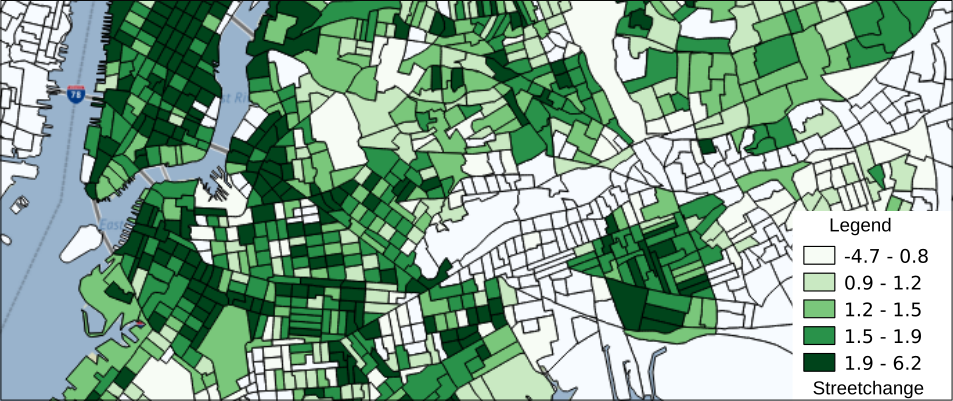
By computing Streetchange for every street block, and aggregating Streetchange data at the census tract level, we generated metrics for improvement or decline in physical appearance of neighborhoods, as seen here for Brooklyn and Lower Manhattan, New York.
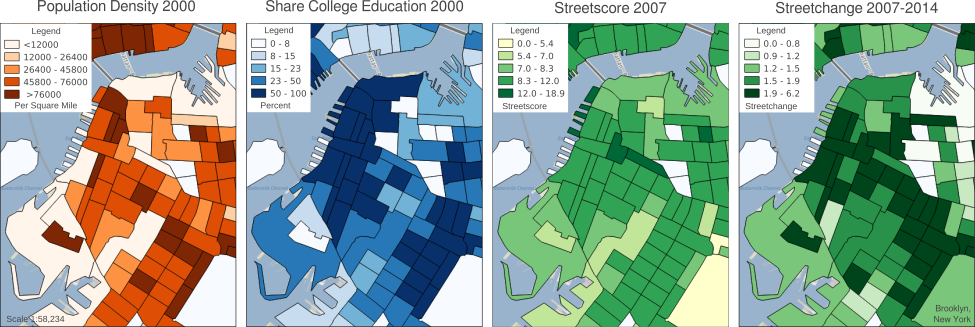
Finally, we related the Streetchange of 2,514 census tracts from Baltimore, Boston, Detroit, New York, and Washington DC to demographic and economic characteristics. With this data, we identified the socioeconomic predictors of positive Streetchange, which is indicative of improvement in physical appearance of neighborhoods. We found that neighborhoods that contained dense, highly-educated populations, those that had better initial appearance, and those that were closer to downtown experienced most physical improvement during 2007–2014. These maps visualize population density, education, initial appearance, and physical growth for census tracts in Brooklyn, New York.
Streetchange is able to identify a variety of changes in neighborhoods from images: small improvements in building facades due to upgrading, large-scale construction surrounding new transportation infrastructure and parks, and urban decay due to abandoned housing. We describe a few salient examples in our dataset next.
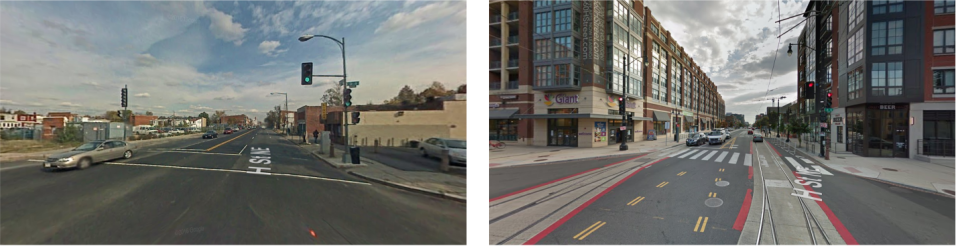
This image pair from Washington DC, captured in 2007 (left) and 2016 (right), shows the physical change in the H Street neighborhood, including a new light rail line (the H Street/Benning Road Line of the DC Streetcar transit system) and a new supermarket.
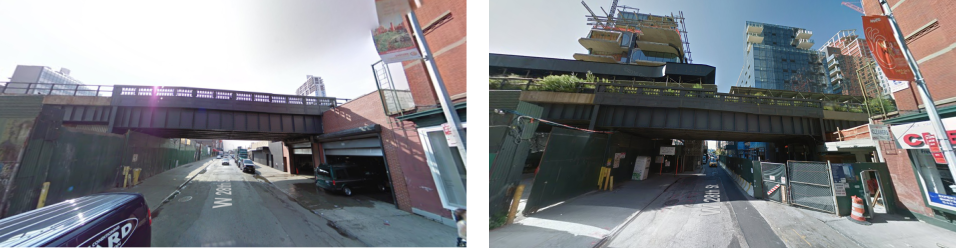
This image pair from New York, captured in 2009 (left) and 2016 (right), shows the physical change around the High Line Park in the Lower West Side of Manhattan. Streetchange detected several large construction projects surrounding the High Line Park.
Streetchange is able to detect improvements in buildings as well (and not just large construction projects), as seen in this image pair from Brooklyn, New York, captured in 2007 (left) and 2014 (right).
Atlantic Citylab, Fast Company, Forbes, Harvard Gazette, HBS Working Knowledge/Quartz, MIT News, New York Times, Yahoo! News


Harvard University

Harvard Business School

MIT Media Lab

Harvard University

MIT Media Lab